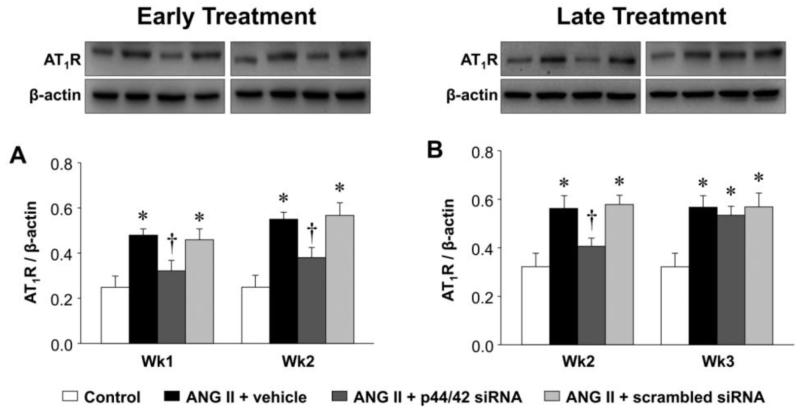
Figure 5.
Quantitative comparison of protein level of AT1R in the PVN of ANG II-infused rats treated early (A) or late (B) with PVN microinjections of p44/42 MAPK siRNA, a scrambled siRNA, or vehicle. Untreated rats served as Control. Representative Western blots are aligned with the matching grouped data. Values are corrected by β-actin and expressed as mean ± SEM (n = 4 for each group). *P< 0.05, vs. Control; †P< 0.05, ANG II + p44/42 siRNA vs. ANG II + vehicle or ANG II + scrambled siRNA.

