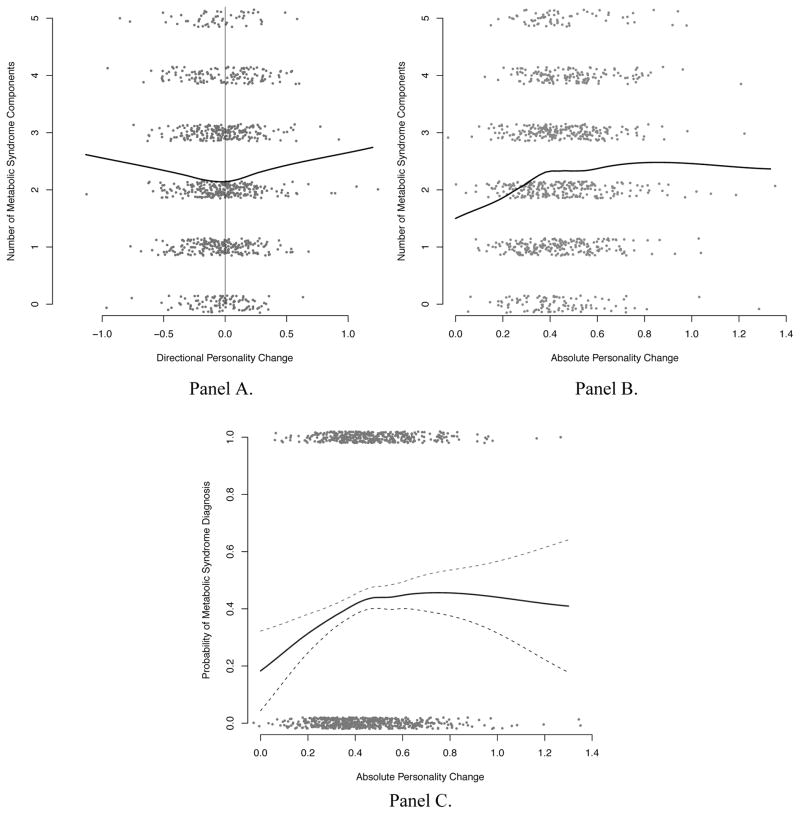
Figure 2.
Directional (Panel A) and absolute (Panel B) personality change predicting metabolic syndrome components, and absolute personality change predicting the probability of metabolic syndrome diagnosis (Panel C). Not diagnosed = 0, Diagnosed = 1. Dashed lines represent the 95% confidence interval around the nonparametric loess curve. Data are slightly jittered (randomly perturbed) to minimize overplotting.

