
Figure 2. ReHo comparison results between different states.
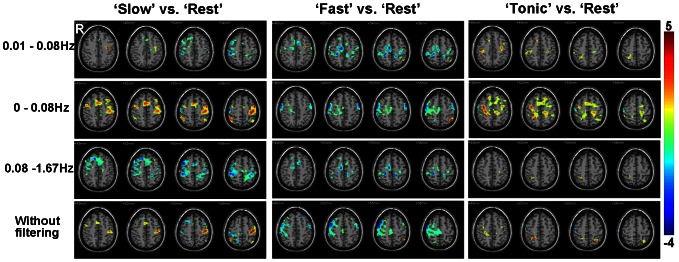
The results comparing the ReHo of the three task states with that of ‘Rest’ state with different band pass filtering (0.01–0.08 Hz, 0–0.08 Hz, 0.08–1.67 Hz) and without filtering. Warm color represents higher ReHo than ‘Rest’ state, cold color represents lower ReHo than ‘Rest’ state (p<0.05, uncorrected).