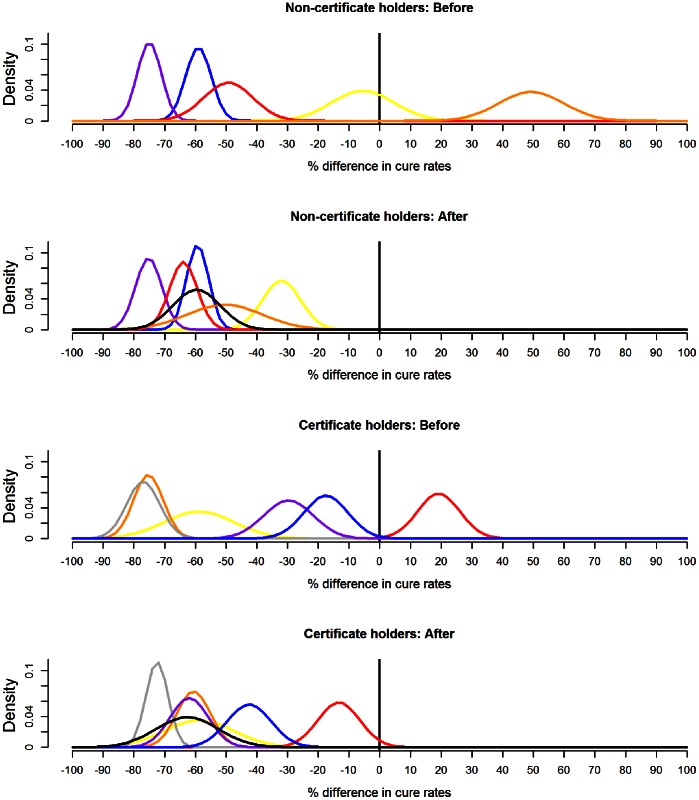
Figure 1. The fitted probability distributions, before and after a review of the evidence.
Gaussian probability density functions fitted to the raw data for each veterinary surgeon individually, before and after a presentation of a review of the current evidence. The % difference in cure rates refers to ewes, lame with footrot, within five days of receiving either (i) systemic and topical oxytetracycline or (ii) foot trimming and topical oxytetracycline. Positive differences favour foot trimming and topical oxytetracycline, negative differences favour systemic and topical oxytetracycline. Non-certificate holders: vet 1 = yellow, vet 2 = blue, vet 3 = purple, vet 4 = red, vet 5 = orange. Certificate holders: vet 6 = yellow, vet 7 = orange, vet 8 = red, vet 9 = grey, vet 10 = purple, vet 11 = blue. The fitted probability density function to the group consensus raw data is shown in black. Values for the fitted hyperparameters (mean and variance) are listed in Table 3. The current published evidence supports a difference in cure rates of 60% in favour of systemic and topical oxytetracycline [4].

