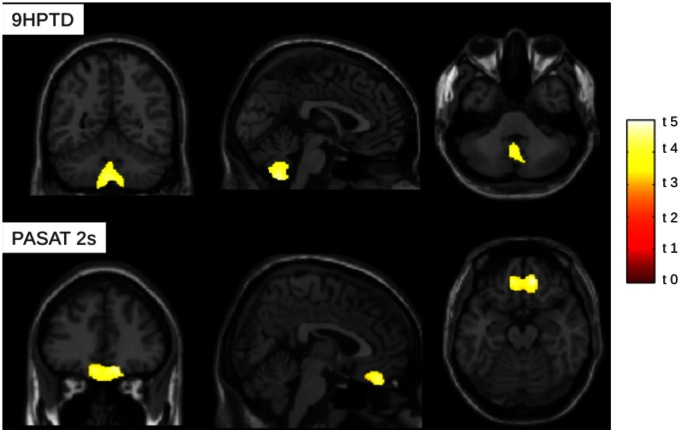
Figure 2. Correlation between GM volume in patients and MSFC subscales.
On the top of the figure, GM volume negatively correlates with 9HPTD score at cerebellum level. On the bottom of the figure, GM volume positively correlates with PASAT 2 s at level of orbitofrontal cortex. Clusters of significant correlations are superimposed on sagittal, coronal and axial slices of the single-subject T1 template provided with SPM8. (VBM analysis, SPM 8, one-sample, p<0.05, FWE corrected; t values are shown).

