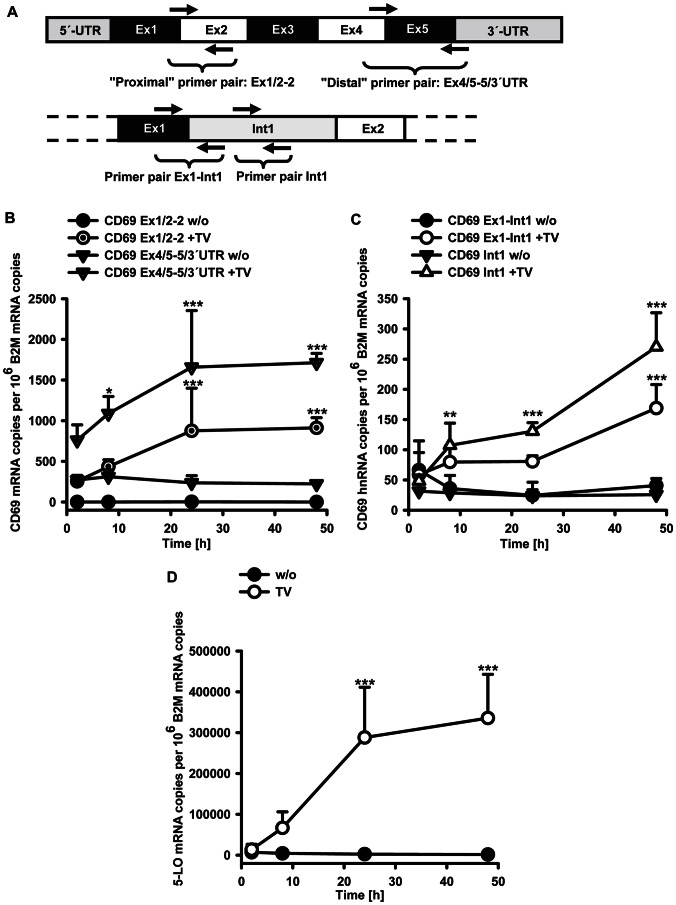
Figure 3. Time dependence of CD69 and 5-LO mRNA induction by TGF-β/1α,25(OH)2D3.
(A) Schematic overview of primer positions on CD69 mRNA (exon and intron sizes are not to scale). (B, C and D) Cells were treated for 2, 8, 24 and 48 h with (TV) or without (w/o) TGF-β/1α,25(OH)2D3 (1 ng/ml and 50 nM, respectively) and mRNA levels were determined by qPCR. Statistical analysis was done by two way ANOVA and Bonferroni's post test (*P<0.05; **P<0.01; ***P<0.001). The two parts of CD69 gene were analyzed independently. In (B and C), significances as determined by the Bonferroni post test on the data for each part of the gene, compared with the corresponding untreated control, are displayed.

