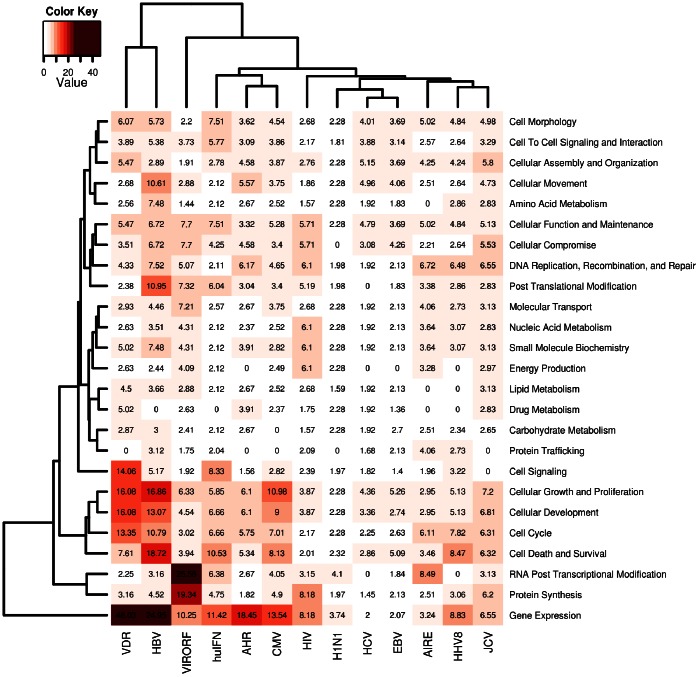
Figure 1. Heatmap from Ingenuity Pathway Analysis of each interactome.
Statistical significance (in –log[p-value] notation, where p<0.05 corresponds to a –log[p]>1.3) of the functional components in each interactome, as obtained through a Comparative Core-Analysis in IPA (Ingenuity Pathway Analysis). The functional components identified at the molecular and cellular level are presented row-wise (right); the interactomes are presented column-wise (bottom). Each cell in position (i,j) contains a number that represents in −log notation the strength of the association between the functional class i and the interactome j; this information is also color-matched with a color gradient that moves from white (−log[p] = 0.0, p = 1) to crimson (−log[p] = 50, p<10−50). Two hierarchical cluster analyses were employed to group functional classes that share similar patterns of associations across all interactomes (left-side clustering), and to group interactomes that share similar functional compositions (top-chart clustering).

