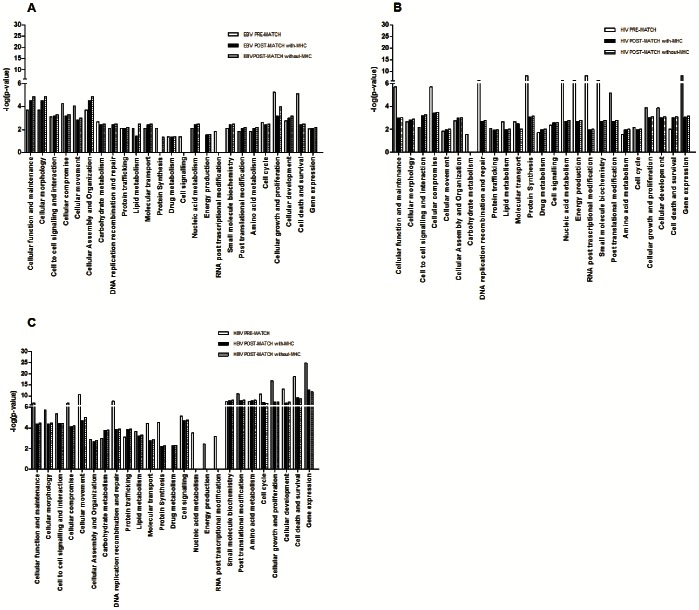
Figure 3. Histograms of functional class distribution of MS-associated interactomes.
The histograms show the strength of the association between each IPA functional class and the 3 MS-associated interactomes (EBV [A], HIV [B] and HBV [C]). For each functional class 3 values were derived according to its distribution before (Figure 1) and after (Figure 2, with and without MHC [Major histocompatibility complex]) the ALIGATOR (Association LIst Go AnnoTatOR) statistical analysis of association.

