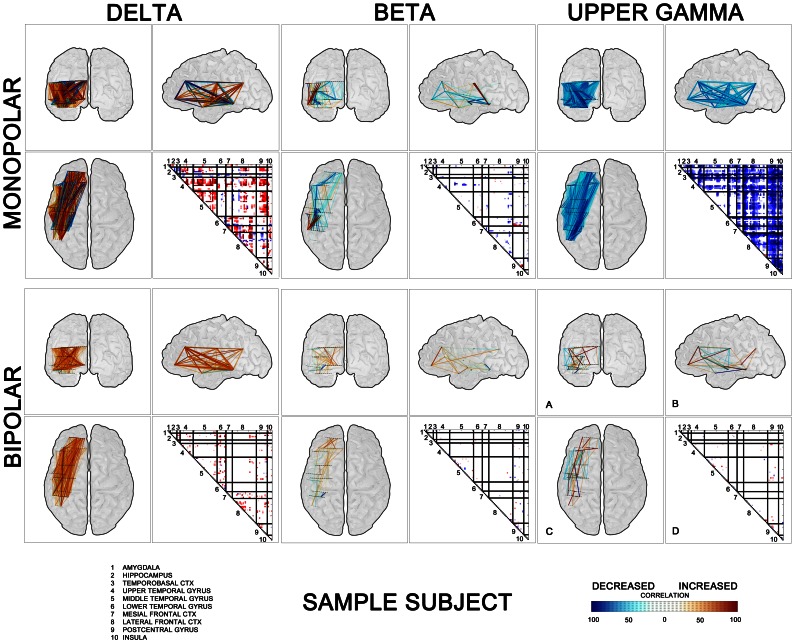
Figure 2. An example of spatial representation of post-stimulus interactions after targets between all investigated brain sites in one subject (No.7).
Correlation results are arranged in the triangular matrices into groups according to brain structures (delimited by black lines)(D) and in graphic form of “glass brains” with linked pairs of investigated electrode contacts (A – Coronal, B – Sagittal, C – Axial). Matrix values and links are colored according to the percentage of duration of the increase (red) or decrease (blue) in cross-correlations within time window 250–750 ms after stimulation. Three selected frequency bands – δ (left panel), β (middle panel), and upper γ (right panel).

