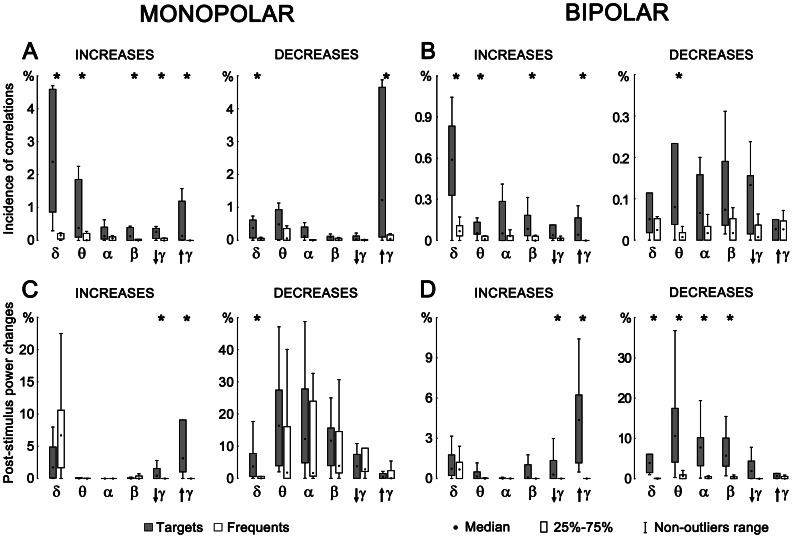
Figure 3. Relative incidences of significant post-stimulus changes in inter-areal cross-correlations (A – monopolar; B – bipolar) and post-stimulus power changes (C – monopolar; D – bipolar) across all investigated subjects.
Statistical significance of target/frequent differences is indicated by asterisks.

