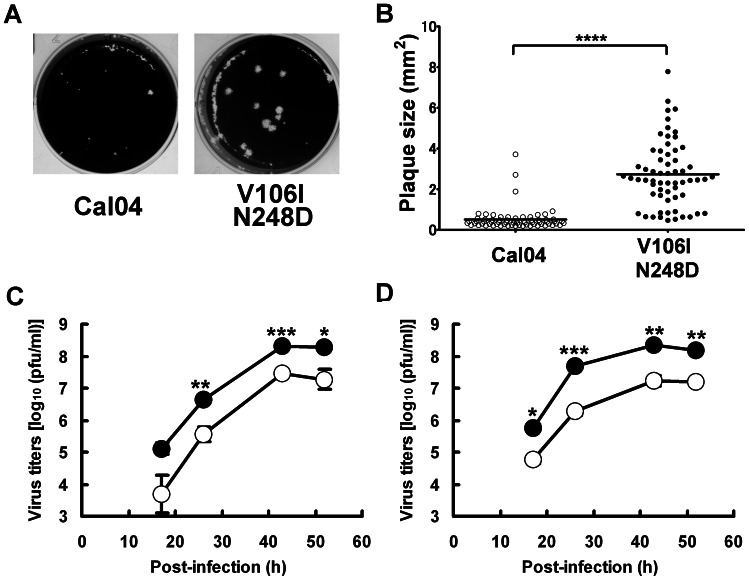
Figure 2. Comparison of plaque size and virus replication between the wild-type and an NA mutant virus.
Cal04 denotes the wild-type virus and V106I N248D denotes the NA mutant virus with both the V106I and N248D of Cal04. A, Images of plaque formation. B, Comparison of plaque size. Cal04, n = 67; V106I N248D, n = 62. C, Growth curves in MDCK cells. D, Growth curves in Calu-3 cells. Closed circles, V106I N248D; open circles, Cal04. The Mann-Whitney U test and paired t-test were used for statistical analysis in (B) and (C and D), respectively. *. P<0.05; **, P<0.01; ***, P<0.001; ****, P<0.0001.

