
Figure 1. Heatmap showing differentially expressed genes in (A) testis and (B) liver samples.
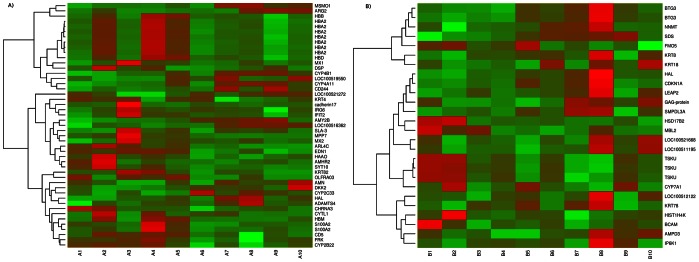
The red blocks represent over expressed genes, and the green blocks represent under expressed genes. Legend: A1–A5 testis with low androstenone and A6–A10 testis with high androstenone, B1–B5 liver with low androstenone and B6–B10 liver with high androstenone.