
Figure 3. Functional grouping of DEGs in liver with high and low androstenone using Ingenuity Pathways Analysis software.
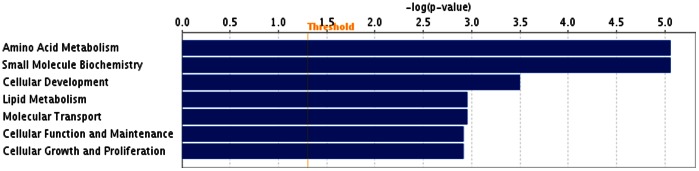
The most significant functional groups (p<0.05) are presented graphically. The bars represent the p-value on a logarithmic scale for each functional group.