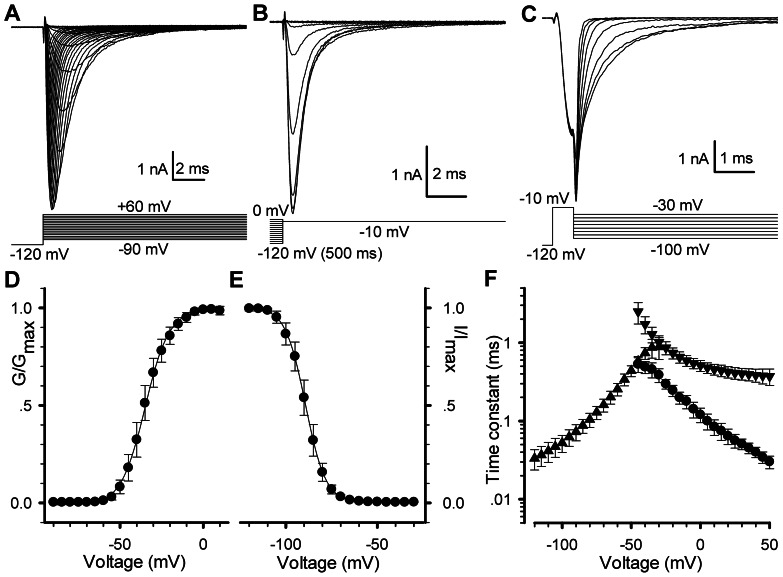
Figure 1. The currents and kinetic characteristics of voltage-gated sodium (Nav1.5) channels expressed in HEK293.
(A–C) The representative currents of Nav1.5 channels were produced with the voltage protocols placed at the bottom, respectively. (D and E) The G–V curve (D) and channel availability curve (E) were measured from (A) and (B), respectively. Normalized curves were fitted to the Eq. 1 and Eq. 2. For activation, V50 = −34.5±1.5 mV (P<0.001) and k = 7.2±0.6 (n = 14); for steady-state inactivation (availability), V50 = −89.1±1.6 mV and k = 5.5±0.4 (n = 11). Error bars represent S.D.. (F) Time constants are plotted as a function of membrane potentials. The time constants of activation (circle) and inactivation (triangle down) and deactivation (triangle up) were derived from mono-exponential fits to the data shown in (A and C).

