
Figure 1. Representative one-dimensional 1H NMR spectra of plasma, urine, and saliva obtained from a healthy control, a HIV/AIDS patient, and a patient on ART.
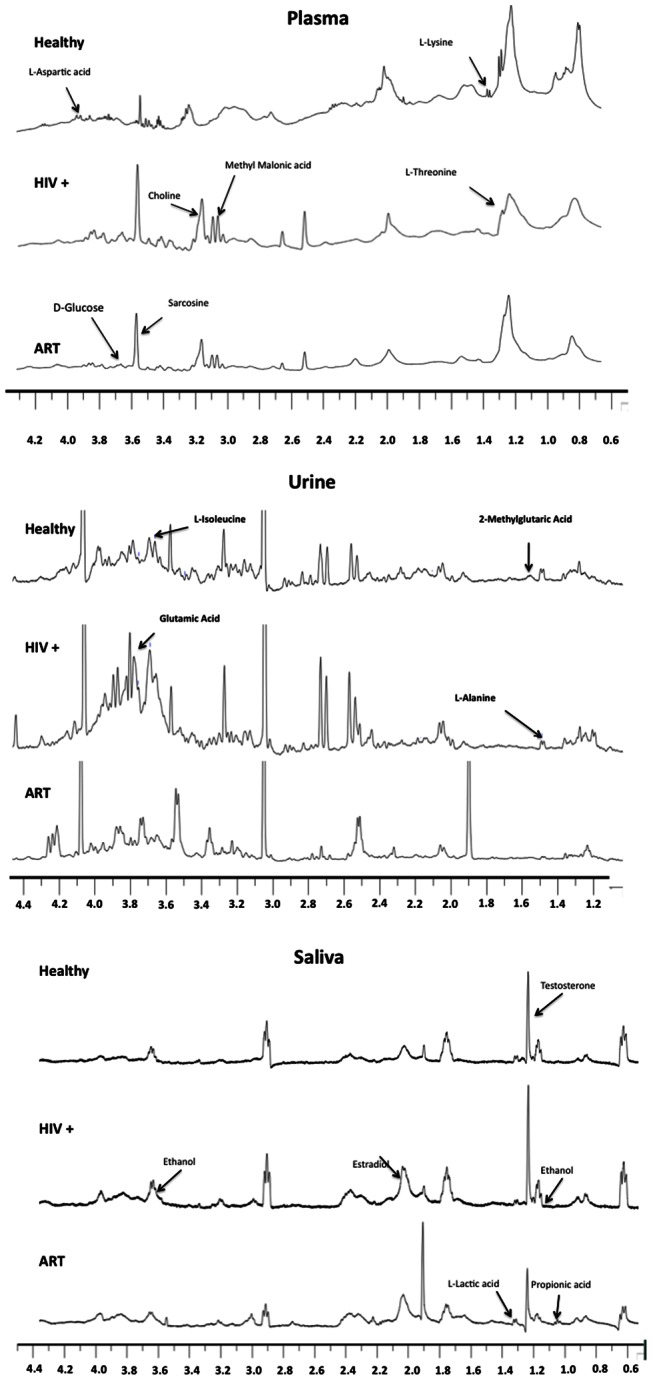
The differences in the intensity of metabolites in different samples are indicated with arrows.