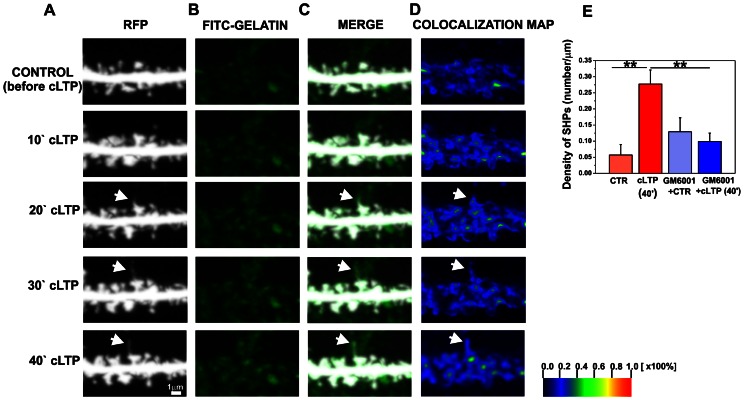
Figure 2. cLTP induces the formation of SHPs in an MMP-dependent manner.
(A) Representative time-lapse imaging of secondary dendrite from pyramidal neuron expressing RFP is shown. (B-C) Cells were preincubated with FITC-gelatin to visualize gelatinase (MMP-9 and MMP-2) activity then were imaged until 40 min of cLTP stimulation. The time course of the appearance of a SHP (marked with arrow) indicates its formation 20 min after cLTP stimulation and it elongated till 40 min. (D) Colocalization maps show increased gelatinase activity at dendritic spine forming SHP (marked with arrow) at 20–40 minutes of cLTP. The colors on the colocalization maps correspond to the color-coded scale bar, indicating the percentage of colocalization and highlights pixels with high and similar intensities. (E) The bar plot shows the quantification (mean ± SEM) of the appearance of new SHPs (number/µm) on dendrites after 40 min of cLTP. Students t-test revealed statistically significant increase in newly formed SHPs after F/R/P stimulation compared to control. The inhibition of MMP activity by GM6001 blocked the development of SHPs in response to cLTP. Students t-test revealed significantly fewer newly formed SHPs in GM6001-pretreated cells than in the cLTP-stimulated group. CTR, before cLTP induction; cLTP, 40 min of cLTP; GM6001+ CTR, GM6001 pretreatment before cLTP induction; GM6001+ cLTP, GM6001 pretreatment and 40 min of cLTP. Results are mean ± SEM, n = 5, **p<0.01.

