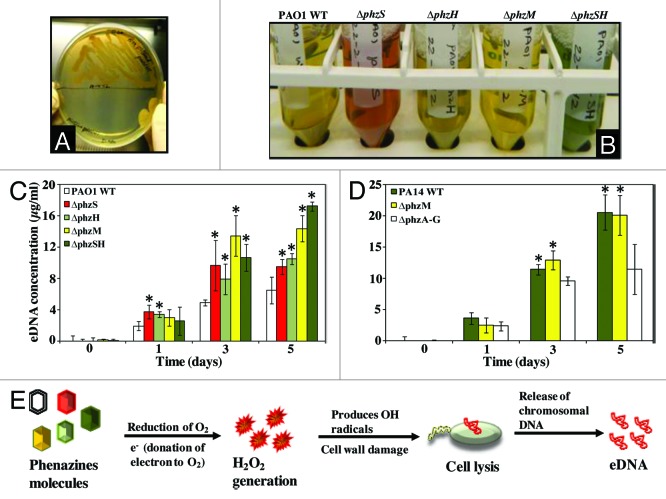
Figure 2. Different kinds of phenazine production and its influence in eDNA release. Comparison of bacterial colony formation on LB agar plate after 48 h incubation with non-filtered (upper half) and filtered (bottom half) bacterial supernatant (A). Production of various kinds of phenazine molecules by P. aeruginosa PAO1 strains (B). Quantification of eDNA release in supernatants of various kinds of phenazine producing P. aeruginosa PAO1 (C) and PA14 (D) strains. Error bars represents standard deviations from the mean (n = 3). Asterisks indicate statistically significant (p < 0.05) differences in eDNA concentration in comparison to the PAO1 wildtype (C) and mutant strain ∆phzA-G (D). Schematic represents the relationship between eDNA release and phenazine production is bridged via H2O2 generation and subsequent H2O2 mediated cell lysis (E).

An official website of the United States government
Here's how you know
Official websites use .gov
A
.gov website belongs to an official
government organization in the United States.
Secure .gov websites use HTTPS
A lock (
) or https:// means you've safely
connected to the .gov website. Share sensitive
information only on official, secure websites.
