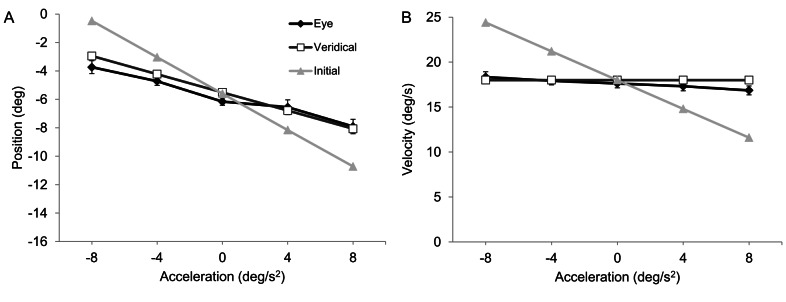
Figure 3. Group mean eye position (panel A) and velocity (panel B) at disappearance (filled black diamonds on black line).

Object position and velocity data at disappearance of actual object motion is represented by filled white squares on black line. Also shown for comparison are position and velocity based on extrapolation of initial object velocity (filled grey triangles on grey line). Capped bars show standard error of the mean.
