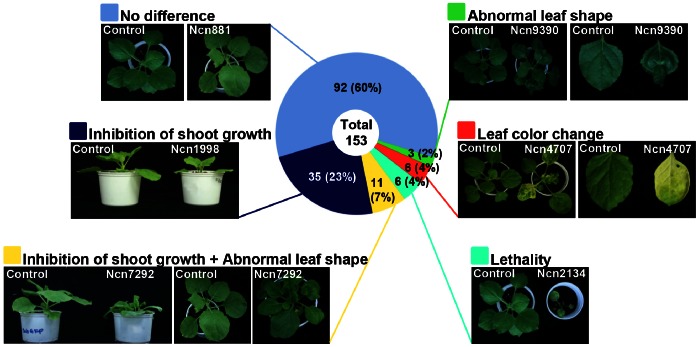
Figure 1. Phenotypic classification of protease-silenced plants.
Protease-silenced plants are categorized into 6 classes. Each class was given with a specific color square box on left side of the class description. Circular diagram indicates the percentage each class. Representative protease described in each class is shown. These phenotype changes had been observed for 3 or 4 weeks and the picture are taken at 3 or 4 weeks after silencing. For every protease gene, 4 plants were silenced at each experiment. Similar results were obtained from at least three independent experiments. One representative experiment is shown.

