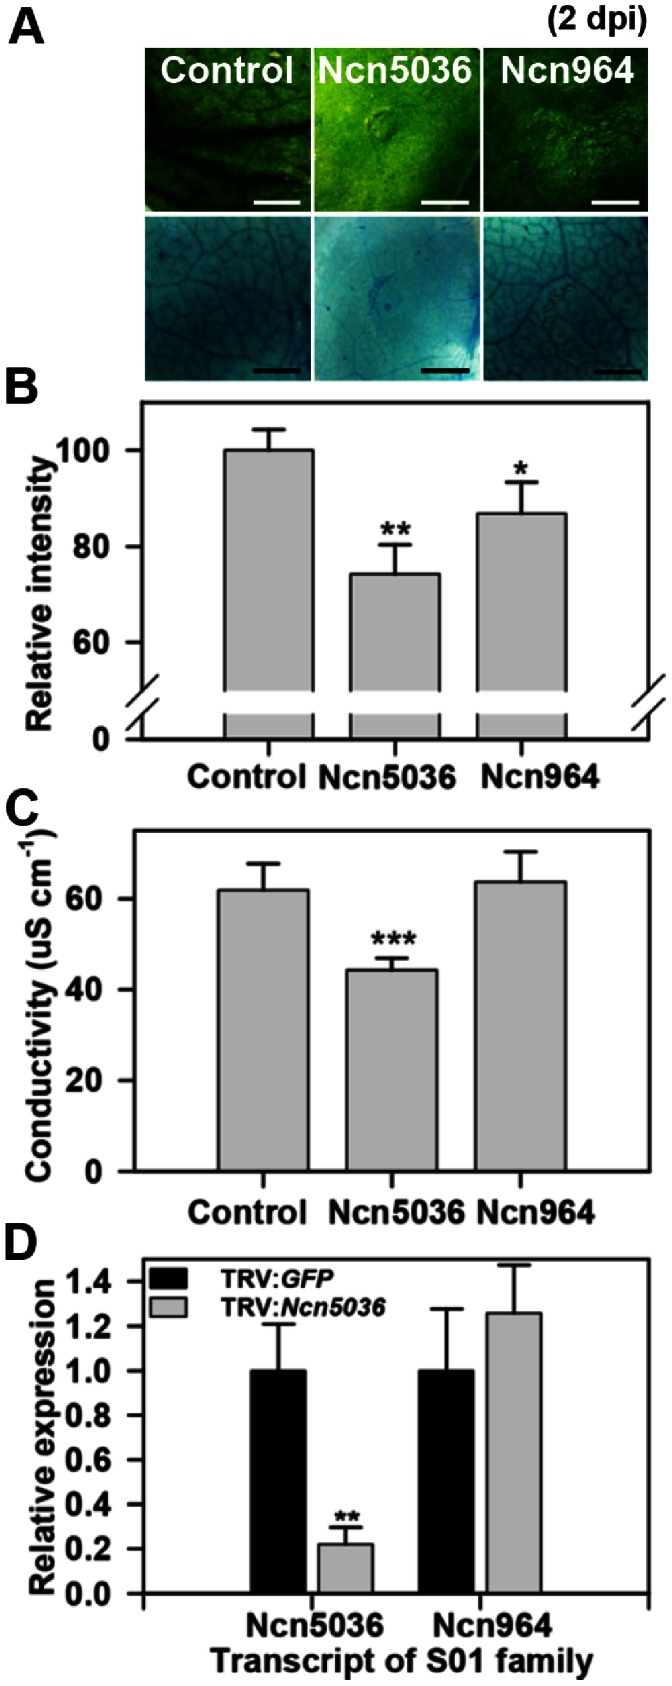
Figure 5. Delayed HR cell death obtained in S01 protease subfamily-silenced plant.

A. HR cell death of S01 protease subfamily-silenced N. benthamiana plant following non-host pathogen infection (P. syringae pv. tomato T1, OD600 = 0.2). HR symptoms were taken at 2 dpi (upper panel). Trypan blue staining at 2 dpi on the same area as the photographs was taken (lower panel). Scale bars = 0.3 mm. B. Relative intensity of trypan blue stained N. benthamiana plants. Values are means±SD (n = 3). Relative intensity was calculated to the control. C. Ion leakage from leaf discs of S01 protease subfamily-silenced N. benthamiana plant following non-host pathogen infection. Values are means±SD (n = 3). D. Transcript level of S01 protease subfamily member was examined in Ncn5036- silenced plant. Values are means±SD (n = 3). The values were normalized to NbActin and were calculated to the control. Similar results were obtained from at least two experiments. One representative experiment is shown. Asterisks indicate significant differences relative to the control as determined by Student’s t test (*P<0.05, **P<0.01, ***P<0.001).
