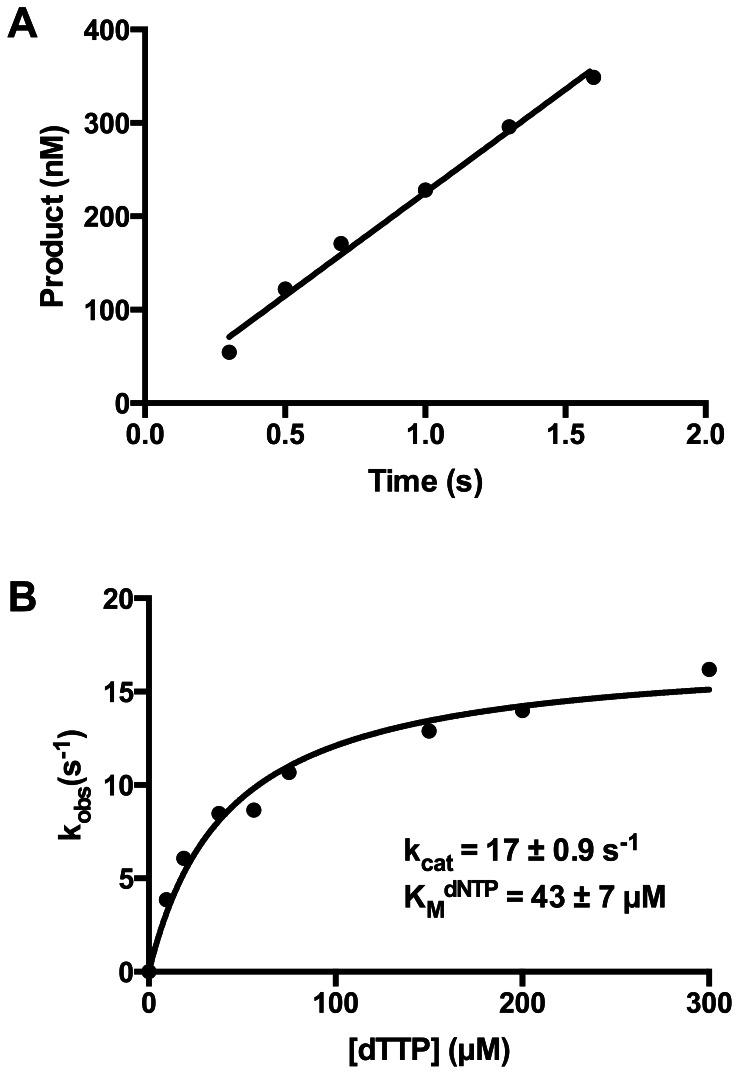
Figure 5. Steady-state kinetic analysis of Sau-PolC-ΔNΔExo.
Primer extension assays were performed by adding dTTP (final concentration range 9.38 to 300 µM) to a final concentrations of 2.5 µM p/t DNA and 16.5 nM active Sau-PolC-ΔNΔExo. The reactions were quenched at different time intervals with 250 mM EDTA. (A) A typical time course of primer extension followed during the steady-state kinetic assays (final [dTTP] was 300 µM). The concentration of primer extended was plotted against time and fit to the steady-state equation (Equation 1). (B) Michaelis-Menten plot for Sau-PolC-ΔNΔExo. The observed rates of primer extension were plotted as a function of the dTTP concentration. The resulting plot was fit to the Michaelis-Menten equation (Equation 2). From the fit, steady-state rate constant (kcat) was calculated to be 17±1 s−1 and Michaelis constant for dNTP (KM dNTP) was determined to be 43±7 µM.

