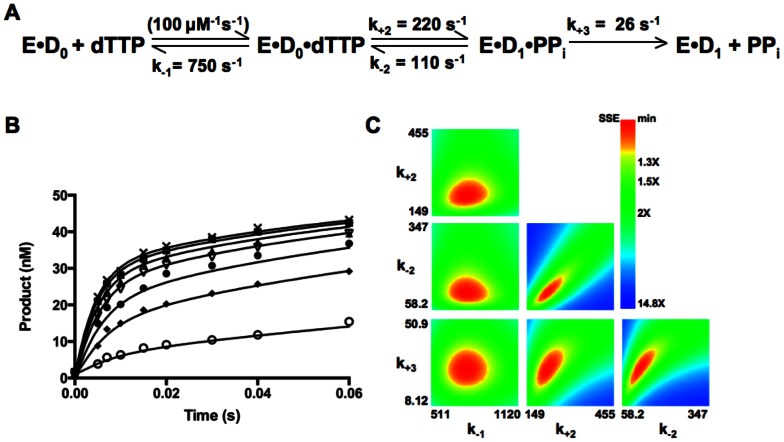
Figure 9. Simulation of kinetic pathway of Sau-PolC- ΔNΔExo.
(A) The three-step reaction mechanism used for the simulation. Values obtained for the different rate constants are shown alongside the appropriate step. Rate of dNTP association to the E⋅D0 binary complex was assumed to be diffusion limited and accordingly the second order rate constant for this step was fixed at 100 µM−1s−1. (B) Simulated curves generated for the representative dataset shown in Figure 8A superimposed on the raw data (concentrations of dTTP shown are ○ 1.17 µM, ♦ 4.69 µM, • 9.4 µM, ▽ 18.75 µM, ▴ 30.14 µM, ▪ 50 µM and ×75 µM). (C) 3-D confidence contours for the various rate constants determined from the simulation. For each case the search was carried out up to a sum of squares error (SSE) that is 2-fold higher than the minimum SSE. The upper and lower limits of each parameter were determined using an SSE threshold of 1.2.

