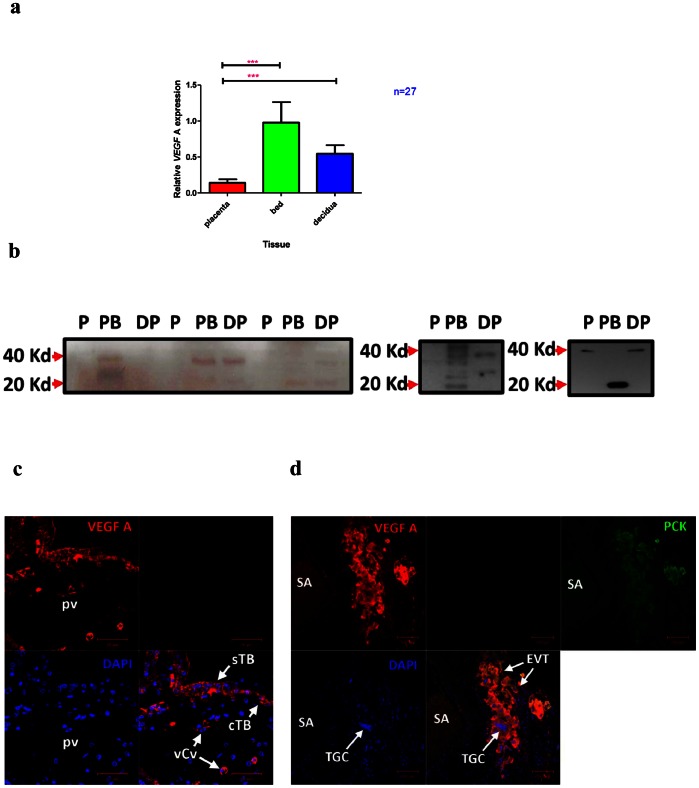
Figure 4. The expression of VEGF-A in the Placenta, Placental Bed and Decidua Parietalis.
Real-time PCR (Means ± SEM) showing mRNA expression of VEGF-A (Fig. 4a), in the three feto-maternal compartments. (***) and (**) signify p<0.001 and p<0.01 respectively. The highest VEGF-A mRNA is expressed in the placental bed. Fig. 4b shows VEGF-A Western Blot Analysis of the Placenta, Placental Bed and Decidua Parietalis obtained from different patients. Bands are present in both the maternal Placental Bed (PB) and Decidua Parietalis (DP). Bands between 20 and 40 Kd represent the various VEGF-A isoforms. The molecular weight of the VEGF is 20 Kd (Kilodaltons) while that of the homodimer is 40 Kd. Figure 4c demonstrates VEGF-A immunostaining in the placenta with VEGF-A protein expression (red) in both the syncytiotrophoblast (sTB) and cytotrophoblast (cTB) cell layers of the placental villus (pv). VEGF-A staining is also observed in the endothelial cells of villous capillary vessels (vCv). DAPI (blue) is used to stain the nuclei. Fig. 4d shows co-localisation of VEGF-A (red) and Pancytokeratin (PCK) (green) in a cluster of Extravillous Trophoblast (EVT) cells staining yellowish-orange. Multinucleated Trophoblast Giant Cells (TGCs) can be seen amongst the EVTs. The lumen of a spiral artery (SA) containing red blood cells can be noticed on the left. DAPI (blue) was used to stain nuclei. The nuclei of the TGCs are different in morphology and size in comparison to those of the surrounding cells.

