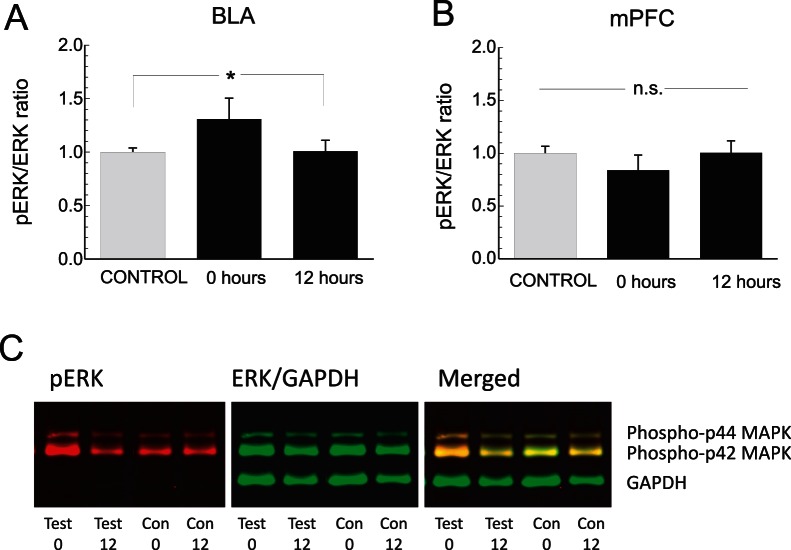
Figure 4. Analysis of pERK and ERK 1/2 protein expression levels in BLA and mPFC tissue during 0 and 12 hr post-conditioning memory consolidation time-points.
A , Analysis of BLA tissue samples at 0 hr post-conditioning reveals significantly elevated pERK levels relative to total ERK levels, but not in vehicle control or 12 hr post-conditioning experimental groups. B , In contrast, no significant differences across groups are observed in the pERK/ERK ratio analysed in mPFC tissue samples. C, Representative Western Blot samples showing fluorescent imaging of pERK and ERK/GADPH bands across experimental groups at 0 and 12 hr post-conditioning time-points.

