
Figure 4. Average reactive hyperemia blood flow data.
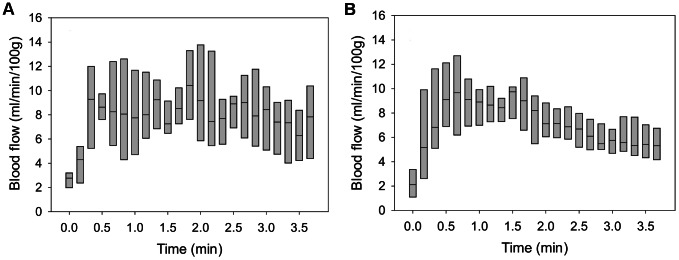
Raw blood flow data was filtered with low pass filters. The filtered data was averaged over all six subjects in each group. Panel (A) shows the averaged data for people with SCI. Panel (B) shows the averaged data for people without SCI.