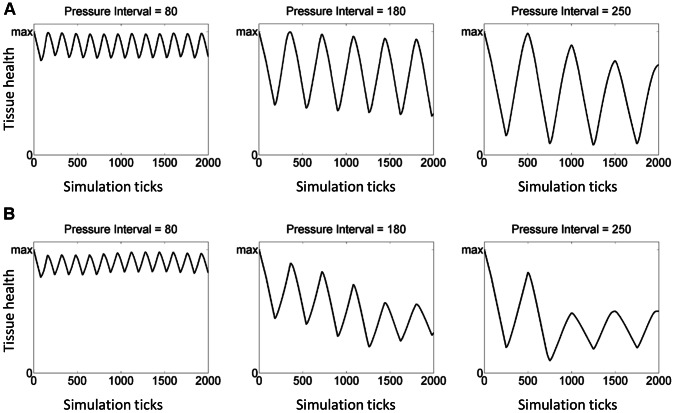
Figure 8. Simulation of different pressure scales on the health of epithelial cells.
Graphs with different values of the pressure interval show how the predicted health of epithelial cells progresses over time for simulations of the control and SCI groups, respectively. Panel (A) shows the outcome of simulations for the control group. Panel (B) shows the outcome of simulations for the SCI group.

