
Figure 2. Local concentration maps of lysozyme and D1.3 in the associated and free states.
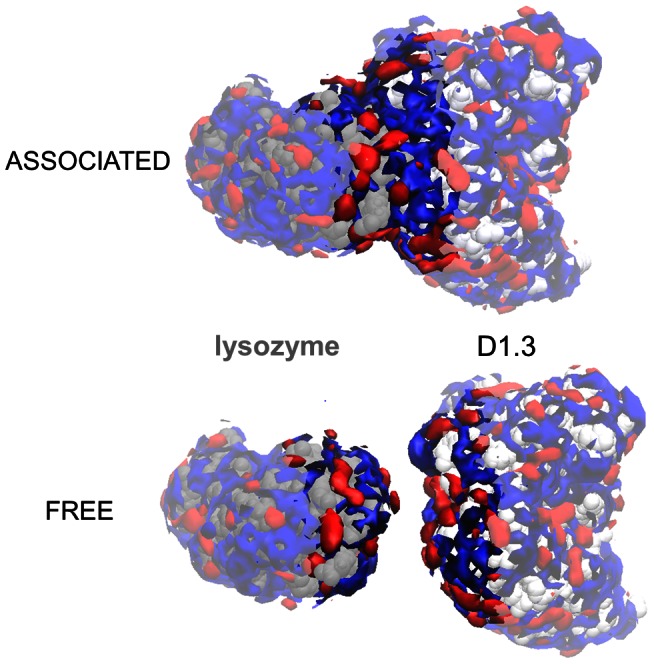
Solvent regions that are preferentially solvated by glycerol and water are colored in red and blue respectively, and solvent regions near the interface region are highlighted.