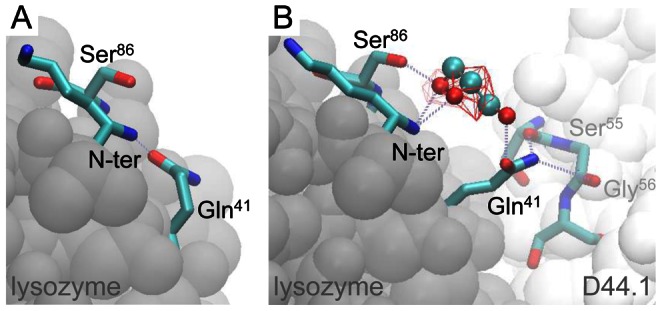
Figure 7. Snapshot of glycerol molecules near the N-terminus of lysozyme in the free state (A) and associated to D44.1 (B).

Hydrogen-bonds are indicated by dotted lines and red wireframes demark solvent regions with high local glycerol concentrations ( >
> ).
).
