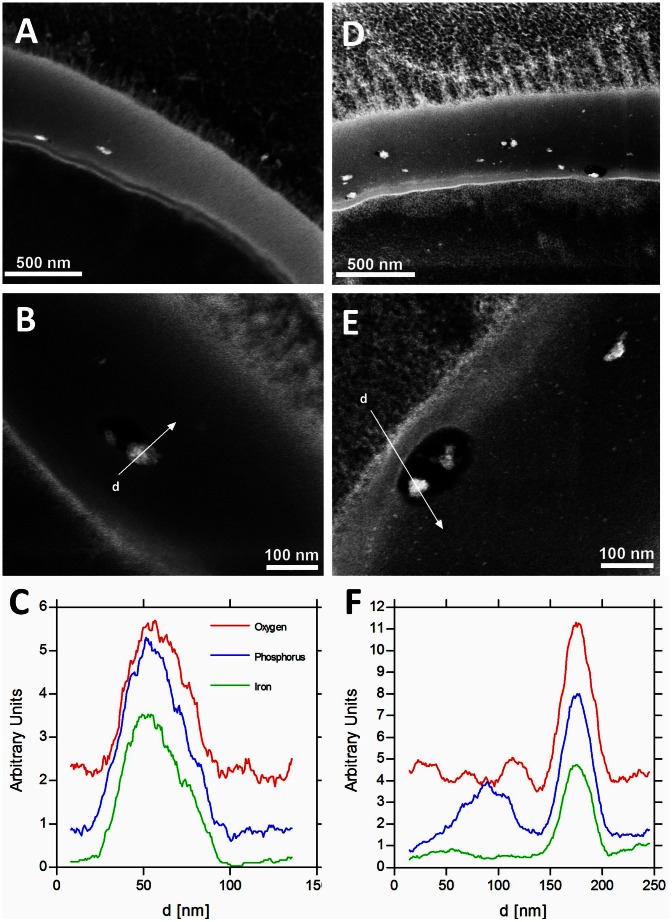
Figure 3. Iron localization within the Schistosoma eggshell.
Panel A shows inclusions of iron phosphate in the shell of S. mansoni at low resolution. Panel B shows similar inclusions in S. mansoni at a higher resolution. Panel C depicts the STEM-EDS spectra for iron, phosphorous and oxygen acquired when scanning across an inclusion, along the white line (d) shown in Panel B. Panels D, E and F show similar observations for S. japonicum.

