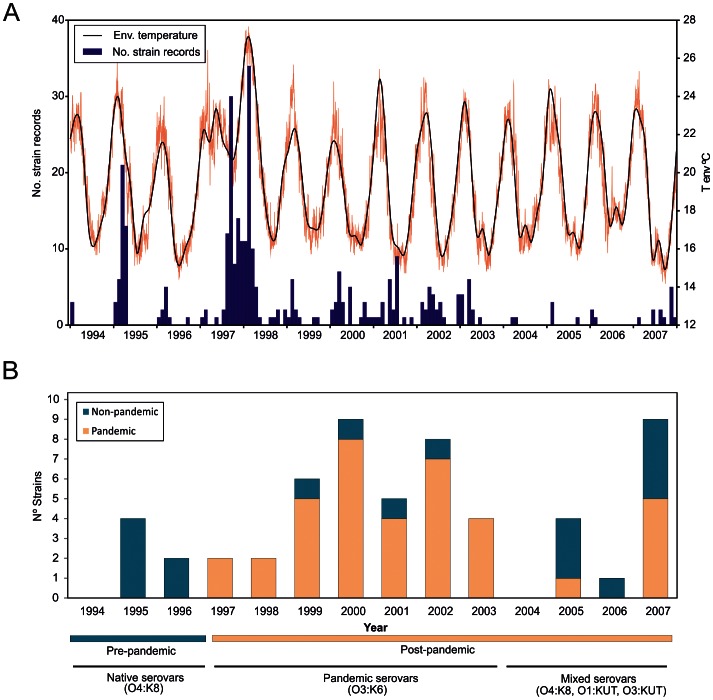
Figure 1. Distribution of V. parahaemolyticus over the study period.
(A) Number of V. parahaemolyticus strains received at the National Institute of Health in Peru between 1994 and 2007 and environmental temperature over the same period. (B) Rate of pandemic versus non-pandemic strains over the study period; information on the dominant serotypes of each period is provided below the X-axis.

