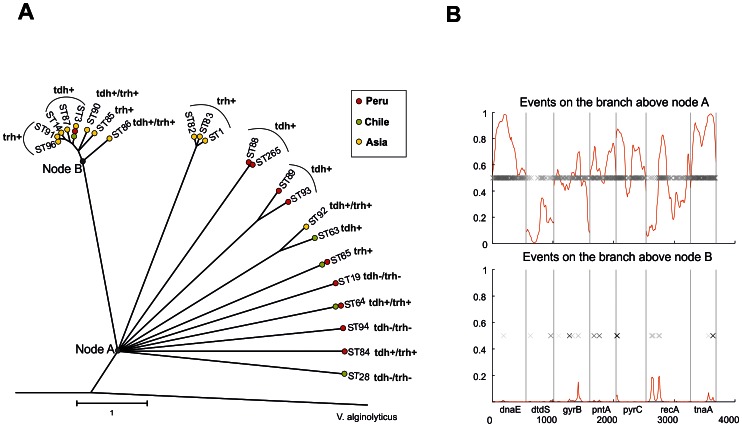
Figure 3. Phylogenetic tree and recombination events.
A). The phylogenetic relationship of 22 V. parahaemolyticus STs was generated using ClonalFrame by 50% majority-rule consensus visualized using MEGA4. V. alginolyticus was used as an outgroup. Nodes A and B correspond to the recombination events presented in Figure 4B. Red, green and yellow circles denote the place of isolation from Peru, Chile and Asia, respectively. Coalescent units are indicated by the scale bar. B) ClonalFrame representation of the recombination event probability occurring in MLST concatenated is represented on the x-axis with the red line indicating the probability at each locus for an import event on a scale from 0 to 1 (y-axis). Each inferred substitution in the graph is represented by a cross, the intensity of which indicates the posterior probability for that substitution.

