Figure 1.
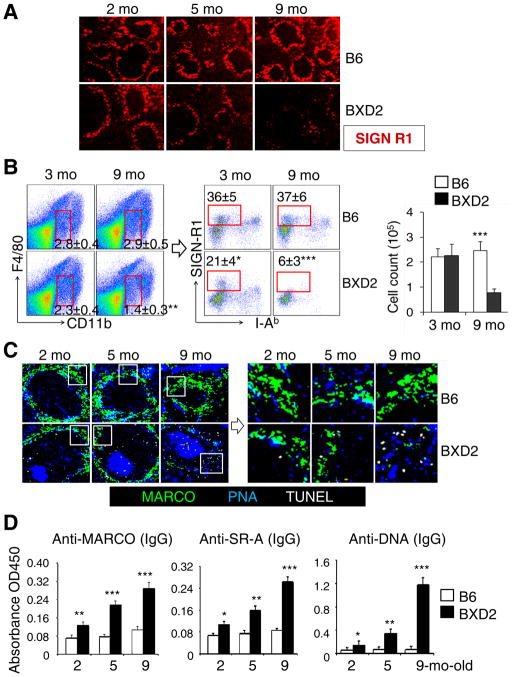
Age-related decrease in MZMs in BXD2 spleens. (A–C) Naive B6 and BXD2 mice were sacrificed at the indicated age. (A) Confocal imaging showing the decline of MZMs in the spleen in BXD2 mice. (B) Left and Middle: FACS analysis showing the frequency of CD11bintF4/80loSIGN-R1+I-Abneg MZMs (rectangle gated cells) in the spleen of B6 and BXD2 mice. Right: total MZM cell count was calculated by multiplying the percentage of MZMs by the total spleen cell count obtained from each mouse. (C) Left: Confocal imaging showing the anatomic location of apoptotic cells (TUNEL+) relative to the location of MZMs (MARCO+) and GCs (PNA+) in the representative follicle; Right, A high power view of the boxed area from the left. (D) ELISA analysis of serum titers of the indicated autoantibodies in the indicated strains. All data are Mean ± standard error of the mean (SEM) (N=3–4 per group for 2 independent experiments; * p<0.05, ** p<0.01, *** p<0.005 between results from B6 and BXD2 of the same age).

