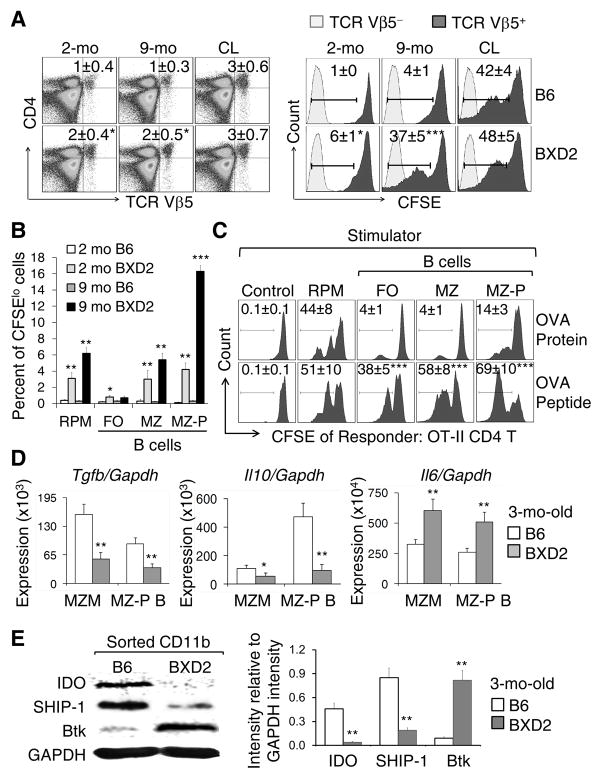
Figure 3.
Stimulation of CD4 T cells by MZ-P B cells carrying apoptotic cell Ags. (A) Left: Flow cytometry analysis on the percentage of the transferred BXD2 OT-II CD4 T cells (TCR Vβ5) in the indicated recipient groups. Right: Flow cytometry analysis of the in vivo OVA-specific proliferative response of Vβ5+ T cells, indicated by attenuation of CFSE intensity, of the transferred OT-II TCR CD4 T cells. Control mice (2-mo-old) were administered CL. (B) Bar graph analysis of the in vitro proliferative response OT-II TCR CD4 T cells (CFSElo) in response to the OVA Ag presented in vivo by the indicated cell populations. The indicated mOVA Ag bearing APCs were FACS sorted from the spleens of mice that have been administered apoptotic mOVA+ thymocytes. (C) Flow cytometry analysis of the in vitro OT-II T cell proliferative response (CFSElo) to either OVA protein or the OVA323–339 peptide processed or presented by the indicated populations of cells FACS sorted from naive 2-mo-old BXD2 mice. CSFE labeled OT-II T cell alone were used as control. (D) RT-PCR analysis of the expression of indicated gene in sorted MZMs and MZ-P B cells derived from the spleen of naive mouse. (E) Left: Western blot analysis of the expression of indicated protein in sorted CD11b cells from naive mice. Right, ImageJ analysis of the intensity of each protein after normalization with the intensity of GAPDH (N=3–4 per group; *p < 0.05; **p < 0.01; ***p < 0.005 compared with the same population of cells from B6 mice for A, B, D, E or from OVA protein stimulated cells for C).

