
Fig. 4.
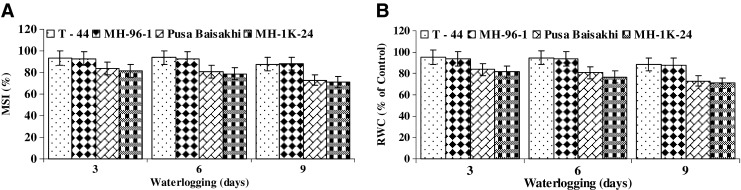
Effect of waterlogging on a membrane stability index and b relative water content of leaf tissues in tolerant (T-44 & MH-96-1) and susceptible (Pusa Baisakhi and MH-1K-24) genotypes of mung bean. For different parameter genotype wise control average values equivalent to 100 % were recorded as: MSI (%) 90.56 (T - 44), 92.22 (MH 96 – 1), 90.23 (Pusa Baisakhi) and 88.29 (MH 1K – 24); RWC (%) 89.23 (T - 44), 87.33 (MH 96 – 1), 86.67 (Pusa Baisakhi) and 83.43 (MH 1K – 24). Vertical bars show ± SD of mean