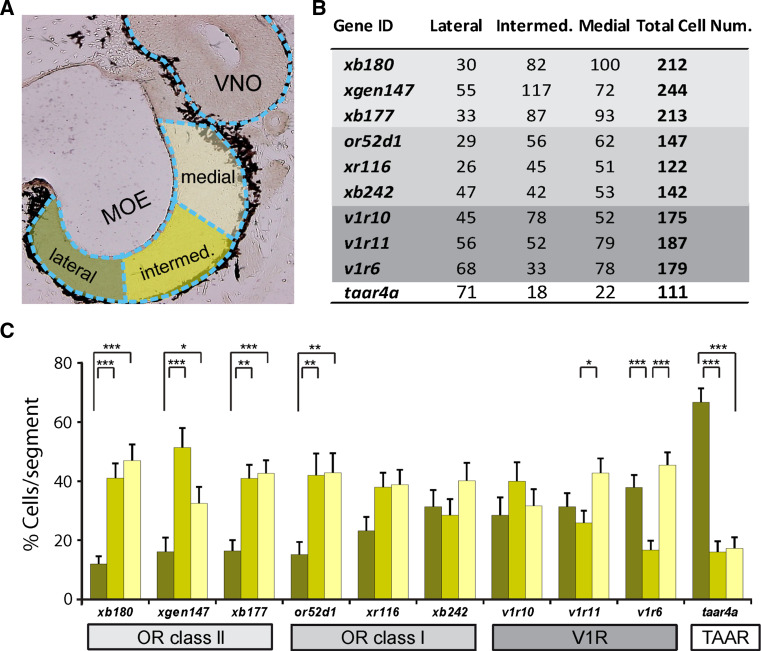
Fig. 7.
Quantification of lateral-to-medial distribution of ten olfactory receptor genes. a Schematic illustration showing the three subdivisions of the MOE, lateral, intermediate, and medial, respectively. b Cumulative number of cells counted for each gene in lateral, intermediate, and medial subdivision and total number. or class II genes light grey background; or class I genes, dark grey background; v1r genes, middle grey background; taar gene, white background. c Quantitative evaluation of the spatial distribution for ten genes, same color code as in a, lateral (dark green), intermediate (light green) and medial (yellow) parts of the MOE. Percentage of cells in each segment was determined for each section, averaged over sections and shown as mean ± SEM. Significance was determined by t test and is denoted by asterisks: *p < 0.05, **p < 0.01, ***p < 0.002, error bars show SEM

