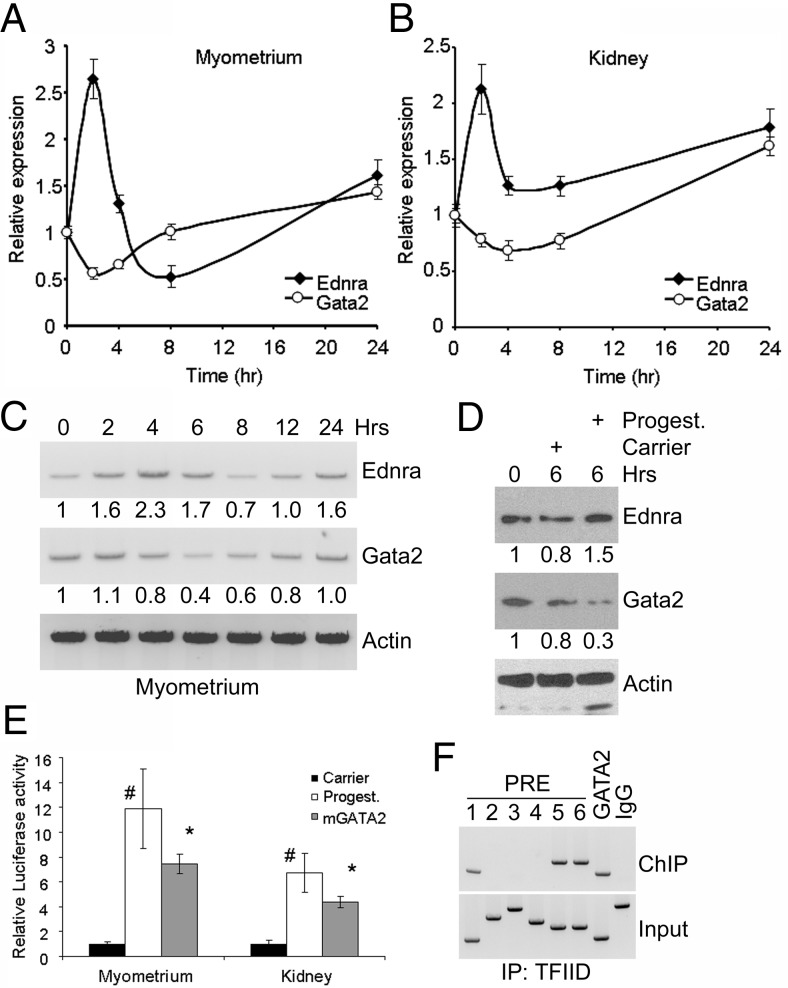
Figure 10.
Regulation of Gata2 expression by progesterone in primary cultured cells. A and B, Relative qRT-PCR quantification of Gata2 and Ednra expression in cultured primary myometrium (A) and kidney (B) cells treated with 4 ng/ml progesterone for up to 24 hours. Control cells were treated with the carrier, and results were standardized with 18S rRNA. Error bars represent SEs. C, Time-lapse analysis of Ednra and Gata2 proteins in cultured primary myometrium cells treated with 4 ng/ml progesterone. Actin was used as a loading control. The numbers below the blots represent the relative abundance of the proteins (compared with time 0). D, Analysis of Ednra and Gata2 proteins in cultured primary kidney cells after 6 hours of treatment with progesterone (Progest.) or carrier. E, Relative luciferase activity in primary myometrium and kidney cells transfected with the Ednra−5.7;−4.2-luc vector and treated with the carrier (black bars) or progesterone (white bars; #, P < .01 vs carrier) or in progesterone-treated cells transfected with the mutated GATA2 site (mGATA2, gray bars; *, P < .05 vs native vector). F, ChIP assay using the TFIID antibody revealed that the PRE1, PRE5, PRE6, and GATA2 sites are recruited in the uterus of 18-day pregnant mice. IgG was used as a negative control (input with PRE3 for that sample).

