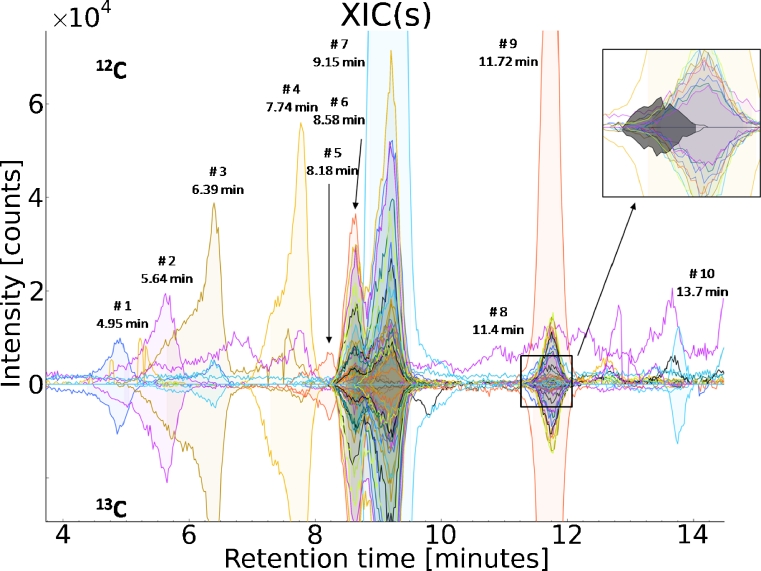
Fig. 1.
EICs extracted by MetExtract: positive intensities show the EICs of the monoisotopic 12C labelled metabolite ions, while negative intensities represent the EICs of the corresponding 13C fully labelled metabolite ions. All of the m/z values labelled with retention time and number showed similar peak area, peak shape and perfect co-elution and thus can be regarded as signals originating from biotransformation products of DON (#2 DON-S-Cys, #3 DON-S-Cys-Gly, #4 DON-GSH, #6 DON, #7 D3G)

