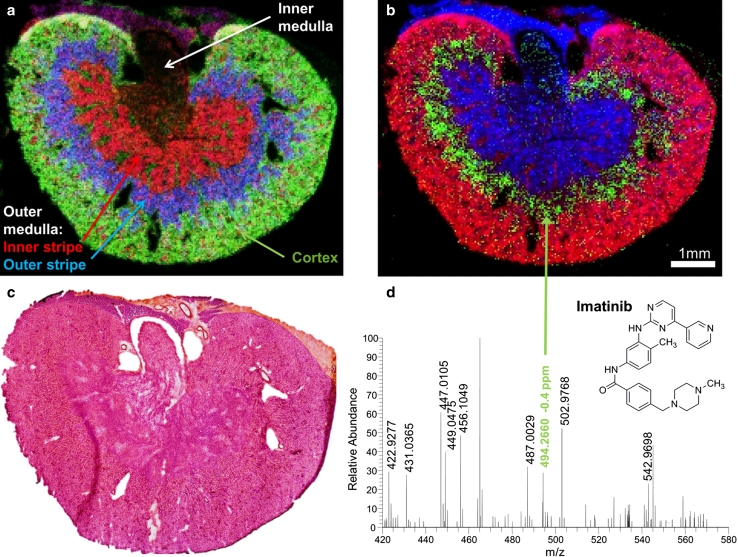
Fig. 3.
Mouse kidney a overlay of selected ion images: green [PC (32:0) + K]+ = 772.5253 cortex, blue [PC (40:6) + K]+ = 872.5566 outer stripe outer medulla, red [PC (38:5) + K]+ = 846.5410 inner stripe outer medulla, 225 × 150 pixels, 35 μm step size, bin width Δm/z = 0.01; b overlay of selected ion images: red [PC (32:0) + K]+ = 772.5253, green imatinib [M + H]+ = 494.2662, blue [PC (34:1) + H]+ = 760.5851, 225 × 150 pixels, 35 μm step size, bin width Δm/z = 0.01; c optical image of the investigated mouse kidney section, H&E stained after MS imaging measurement; d single-pixel mass spectrum of the outer stripe outer medulla of the mouse kidney section. Reprinted from Römpp et al. (2011b)

