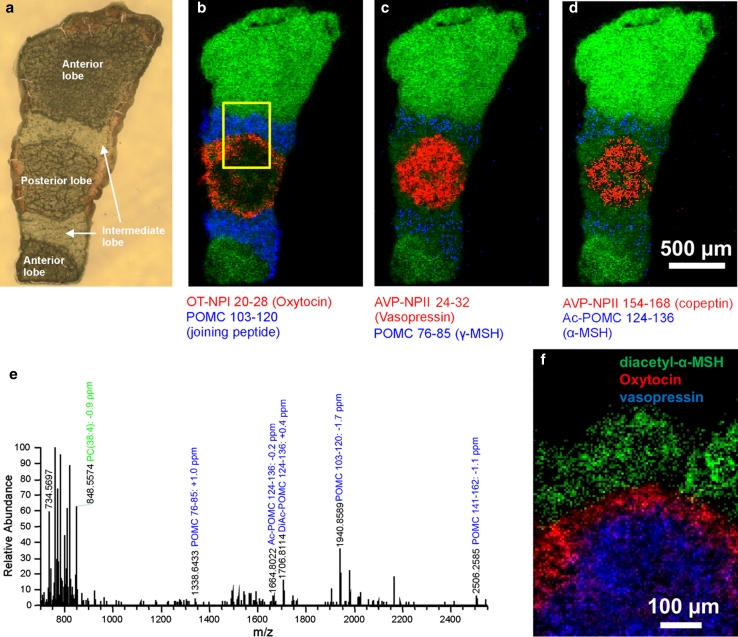
Fig. 4.
Mouse pituitary gland. a Optical image of mouse pituitary gland tissue section, b, c, d overlay of selected peptide ion images (see label below images) with selected ion image of PC (38:4) (green), 155 × 255 pixels, pixel size was 10 μm. e Single-pixel mass spectrum from intermediate lobe. f Overlay of selected peptide ion images, 100 × 140 pixels. Pixel size 5 μm. Yellow square in b indicates the location of the measured region. Modified from original figure by Guenther et al. (2011)

