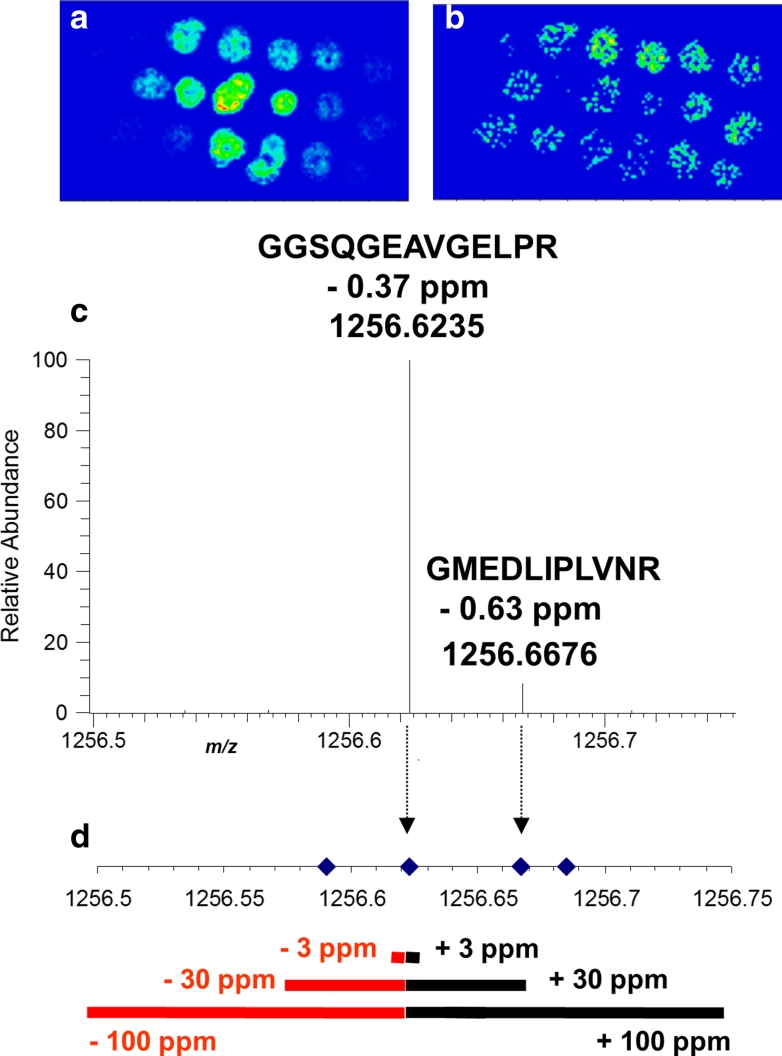
Fig. 5.
a, b Selected ion images of two identified peptides with an imaging bin width of Δm/z = 0.01. c Section of the averaged mass spectrum of high mass accuracy MS imaging of mouse brain tissue, containing two identified tryptic peptides. d m/z values of all tryptic peptides identified in homogenate LC/ESI–MS/MS measurements in the displayed mass range (m/z 1,256.50–1,256.75). Modified from original figure in Schober et al. (2011). Copyright © 2011 John Wiley & Sons, Ltd

