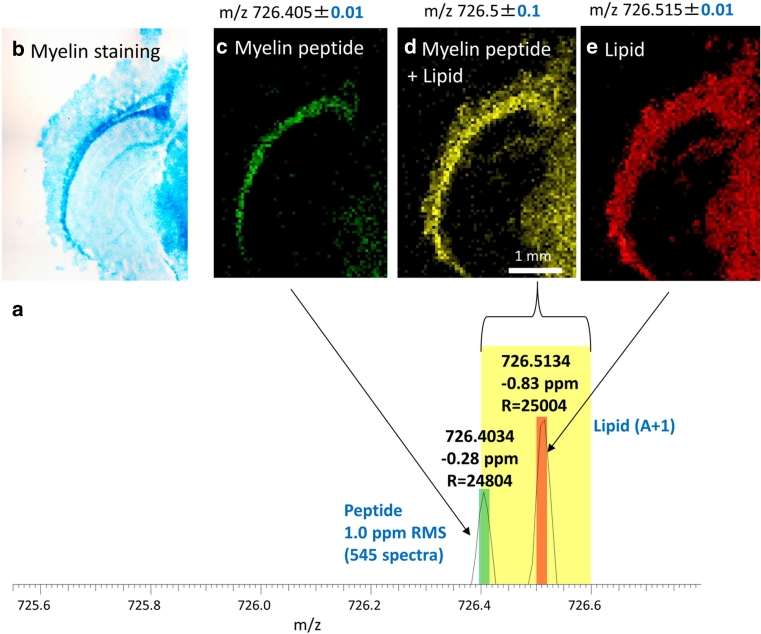
Fig. 6.
Mouse brain (coronal section) after on-tissue tryptic digestion. a Mass spectrum from a single 50-μm pixel. b Optical image of adjacent section after staining for myelin (Luxol fast blue) c, d, e MS images, 50 μm pixel size, 92 × 128 pixels: c selected ion image of m/z = 726.40–726.41 corresponding to myelin peptide. d Selected ion image of m/z = 726.40–726.60. e Selected ion image of m/z = 726.51–726.52 corresponding to lipid isotopologue peak. Details on method can be found in Schober et al. (2012a)

