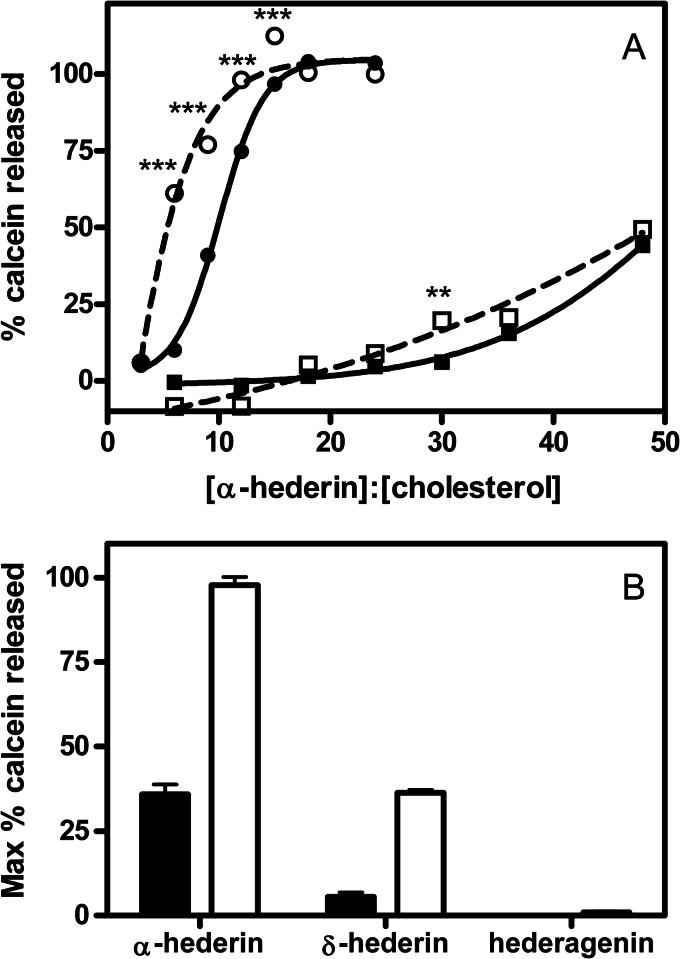
FIGURE 3.
A, release of calcein from liposomes (5 μm of total lipids) upon exposure at 37 °C for 30 min (solid lines; filled symbols) or 18 h (dashed lines; open symbols), upon increasing α-hederin/cholesterol ratios. The liposomes were made of PC/SM/PI/Chol (4:4:3:5.5) (circles), PC/SM/PI/Chol (4:4:3:2.25) (squares). The graph shows the functions obtained by fitting a one-phase exponential association function to the data by nonlinear regression. B, maximal release of calcein from liposomes composed of DMPC/Chol (3:1) upon exposure at 37 °C to α-hederin, δ-hederin, or hederagenin at a compound/cholesterol molar ratio of 16 (closed histogram) or 48 (open histogram). Because of the partial insolubility of α-hederin, δ-hederin, and hederagenin, the three compounds were dissolved in DMSO (final solution 0.5% DMSO). The ordinate shows the percentage of calcein released compared with what was observed after addition of 2% Triton X-100. Each value is the mean of triplicate ± S.D. (when not visible, the bars are smaller than the symbols). Statistical analysis: two-way ANOVA comparing each data point for 30-min and 18-h incubations: **, p < 0.01; ***, p < 0.001).

