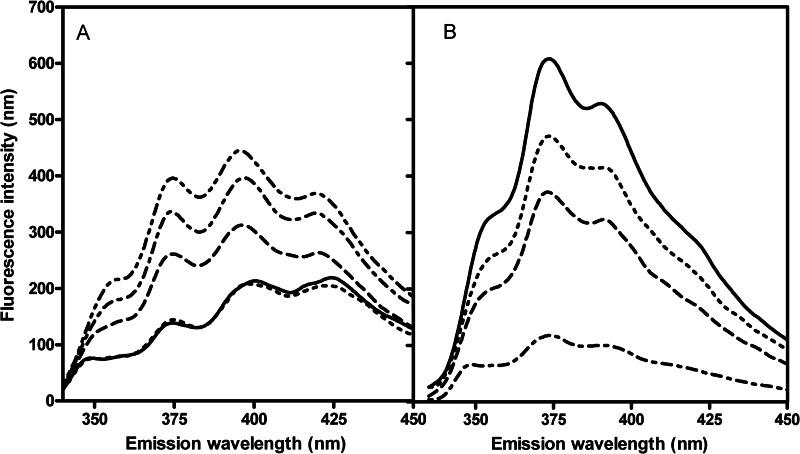
FIGURE 5.
Fluorescence emission spectra of DHE (A) in aqueous solution (4 μg/ml and 0.1% DMSO) and MLV (B) composed of DMPC/Chol/DHE (75:24:1). Excitation wavelength was set at 310 nm. In aqueous solution, spectra were recorded upon increasing α-hederin/DHE ratios. Control (solid line), 0.5 (dotted line), 1.5 (dashed line), 2 (dash dot line), and 4 (dash dot dot line). In MLV after incubation for 3 h (25 °C) at increasing α-hederin/total lipids ratios, spectra were taken. Control (solid line), 0.1 (dotted line), 0.3 (dashed line), and 0.6 (dash dot line).

