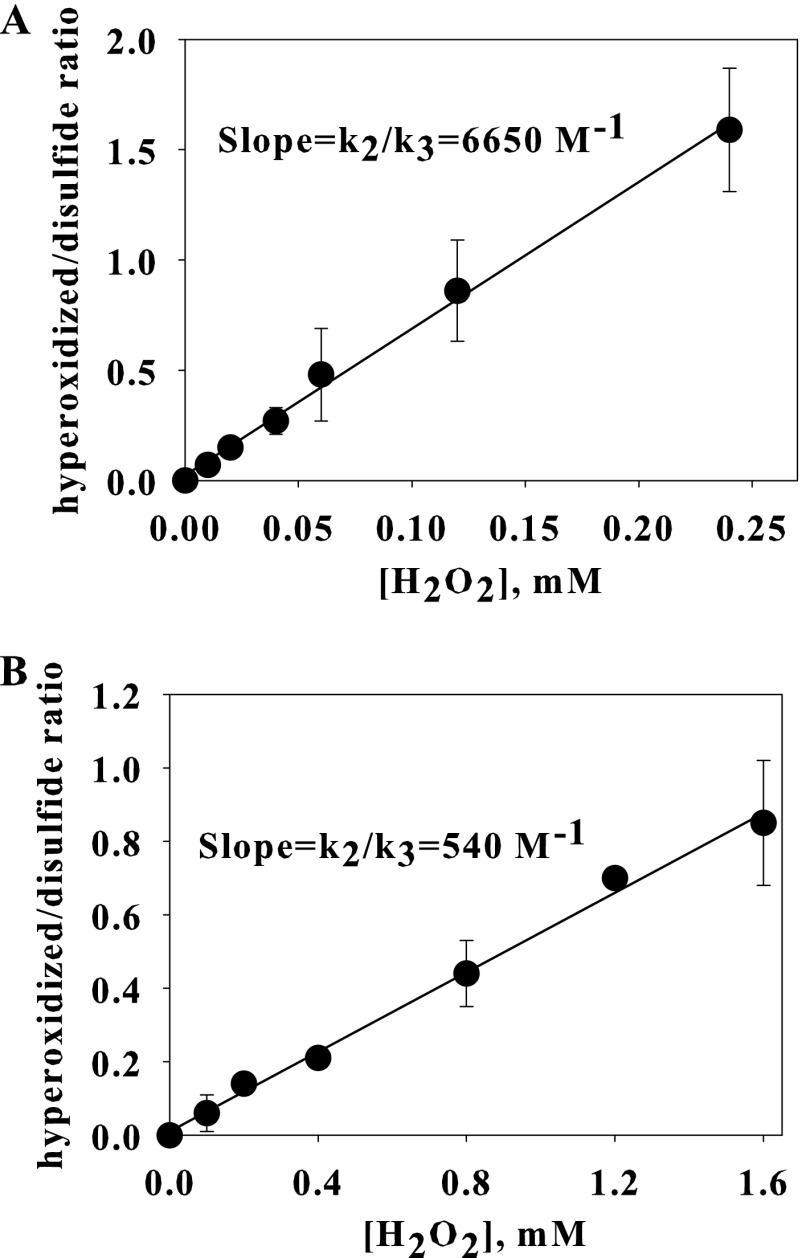
FIGURE 4.
Kinetic analysis of the H2O2 dependence of hyperoxidation of Prx2 (A) and Prx3 (B). Each reduced Prx (5 μm) was treated with the indicated concentration of H2O2, excess of H2O2 was removed by adding catalase, then the proteins were reduced by DTT and alkylated with NEM before analysis by LC/MS. Results are means ± S.D. (error bars) for triplicate experiments.

