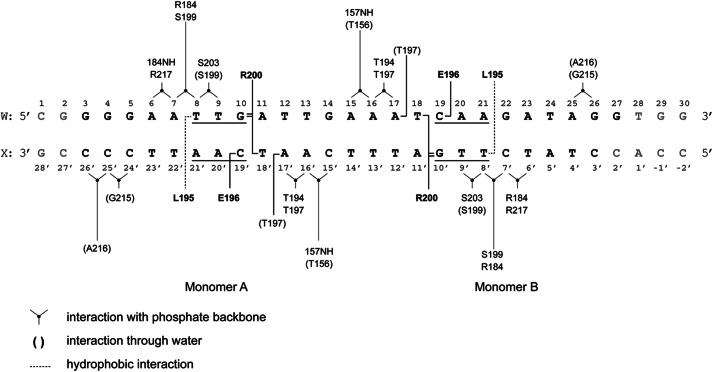
FIGURE 8.
Schematic representation of information on the contact sites between the FixK2 protein and target DNA deduced from the high-resolution structure. Amino acids that undergo specific interactions with nucleotides are indicated by boldface letters. The core FixK2 box is underlined. The gray nucleotides at both ends are those that could not be modeled due to lack of electron density. The types of interactions are indicated in the lower left corner.

