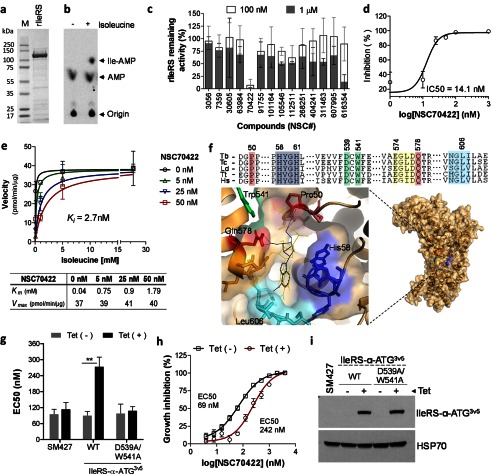
FIGURE 3.
Identification of a competitive inhibitor of T. brucei IleRS. a, T. brucei rIleRS (122 kDa) resolved by 4–20% SDS-PAGE and stained with Imperial Coomassie stain (Pierce). b, rIleRS aminoacylation assay performed with 32P-labeled tRNAIle. P1 nuclease digestion of Ile-tRNAIle resulted in free [32P]AMP and [32P]Ile-AMP, which were separated by TLC. c, inhibition of rIleRS activity with 14 Ile-AMP analogs. Assays were performed with compounds at 0.1 and 1 μm as described previously (25). The molecule NSC616354 is a positive control (25). Data are shown as the percentage of remaining IleRS activity (see “Experimental Procedures”). d, dose-response inhibition of rIleRS with NSC70422. The experiment was performed with 1–1000 nm NSC70422. e, enzymology analysis of NSC70422 inhibition of rIleRS. Assays were performed with 5–50 nm NSC70422 and various concentrations of isoleucine (0.1–20 mm). The Michaelis-Menten constant (Km), maximum velocity (Vmax), and inhibition constant (Ki) were calculated by nonlinear regression with GraphPad Prism software. The table shows the apparent Km and Vmax for IleRS (with respect to isoleucine) in the absence or presence of NSC70422. f, docking of NSC70422 (black lines) and Ile-AMS (yellow lines) in the modeled structure of T. brucei IleRS. The alignment shows amino acids of the IleRS catalytic site. Pro-50 and Gln-578 (red boxes) are involved in isoleucine binding. His-58–His-61 (HYGH motif; blue box) are involved in AMP binding. Yellow, green, and cyan boxes show amino acids of the binding site highlighted in the model (16, 33). Green boxes also show Asp-539 and Trp-541 mutated to alanine in g and i. Asp-539 is not visible in the IleRS model due to the orientation of the binding site, which favors showing the NSC70422 inhibitor. Ile-AMS is an Ile-AMP analog known to interact with T. thermophilus IleRS (16) and was used here for comparison. Tb, T. brucei; Tc, T. cruzi; Ld, Leishmania donovani; Tt, T. thermophilus; Hs, Homo sapiens. g, analysis of NSC70422 EC50 values in T. brucei overexpressing cytoplasmic IleRS (IleRS-α-ATG). NSC70422 EC50 values were calculated for T. brucei SM427 or cell lines overexpressing WT IleRS-α-ATG3V5 or the inactive mutant IleRS-α-ATG3V5(D539A/W541A). Tet, 1 μg/ml tetracycline. h, graph showing the growth inhibition curve shift of NSC70422 EC50 values after overexpression of WT IleRS-α-ATG3V5 in T. brucei. i, Western blot analysis of WT IleRS-α-ATG3V5 and mutant IleRS-α-ATG3V5(D539A/W541A) expression in T. brucei. T. brucei lysates in the presence or absence of 1 μg/ml tetracycline were separated by 10% SDS-PAGE, transferred to a nitrocellulose membrane, and blotted with monoclonal antibodies against the three-V5 tag. The membrane was stripped and reblotted with monoclonal antibodies against HSP70 (mAb78). Data in e are the mean ± S.D. of three single experiments. Data in c, d, g, and h are the mean ± S.D. of at least three experiments performed in triplicate. **, p < 0.007.

