FIGURE 3.
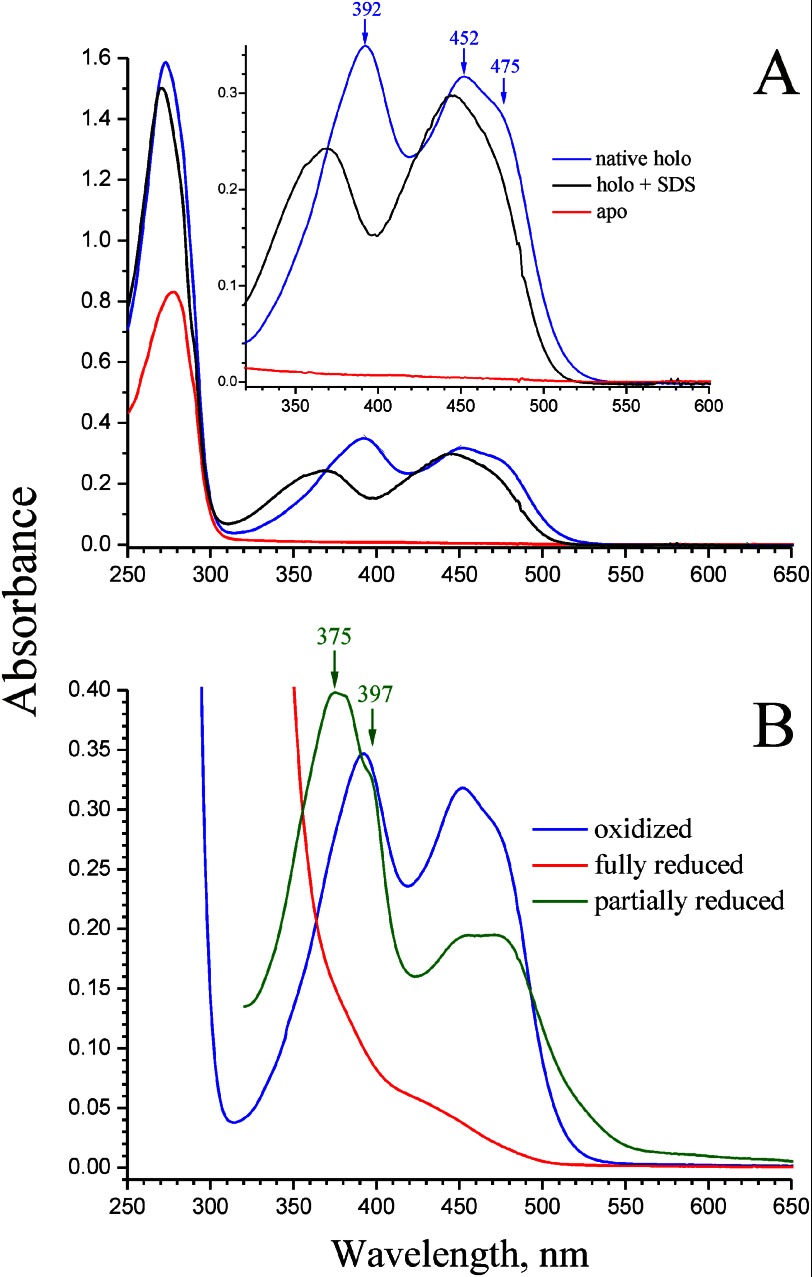
Absorption spectra of recombinant NqrC′ protein of V. harveyi. A, red line, NqrC′ isolated from E. coli/pMshC3 strain (nqrC′ only); blue line, NqrC′ isolated from E. coli/pMshC3 + pΔhis3 strain (nqrC′ + apbE′); black line, NqrC′ isolated from E. coli/pMshC3 + pΔhis3 strain and denaturated with 1% (w/v) SDS. Inset, magnified spectra in the 325–600 nm region. B, HoloNqrC′ purified from E. coli/pMshC3 + pΔhis3 strain. Blue line, air oxidized holoNqrC′ (as isolated); red line, holoNqrC′ fully reduced by excess dithionite; green line, partially reduced holoNqrC′ obtained by slow oxidation of the fully reduced protein by air. Peak labels refer to curves of the same color. The assay medium contained 0.81 mg/ml protein, 20 mm Tris-HCl (pH 8.0), and 50 mm NaCl.

