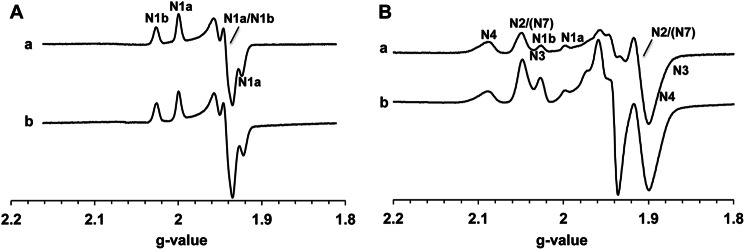
FIGURE 4.

EPR spectra of the isolated complex I. The samples (8.28 mg/ml) were anaerobically reduced with 6 mm NADH (spectrum a) or 20 mm dithionite (spectrum b). The EPR spectra were recorded at 40 K and 2 mW (A) or 13 K and 5 mW (B). The position of the EPR signals arising from each iron-sulfur cluster is indicated. Other EPR conditions were: microwave frequency, 9.45 GHz; modulation frequency, 100 kHz; modulation amplitude, 6 G; time constant, 82 ms.
