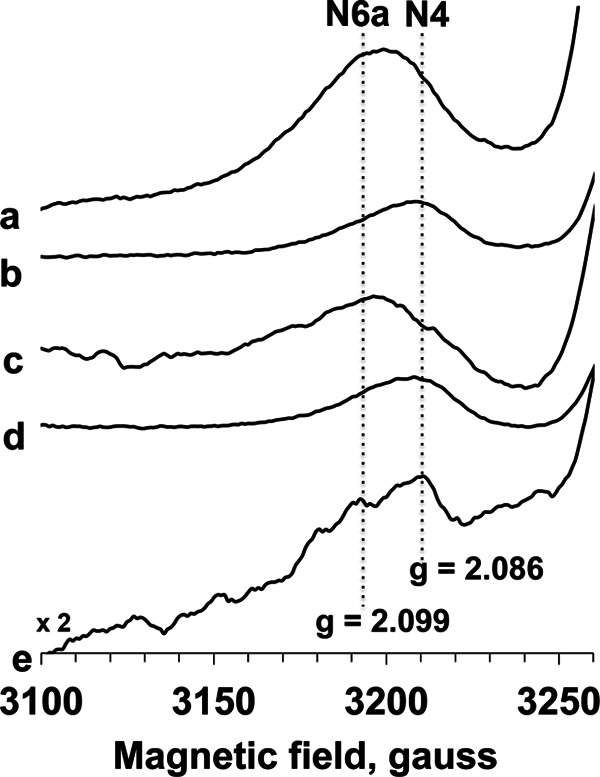
FIGURE 5.

EPR spectra of the gz region of cluster N4 and N6a signals in E. coli complex I. The samples were anaerobically reduced with 20 mm dithionite (spectra a and b) or 6 mm NADH (spectra c and d). The EPR spectra were recorded at 10 K and 204 mW (spectra a and c) or 1.2 mW (spectra b and d). The difference spectra (dithionite-reduce minus NADH-reduced) were taken at 10 K and 81 mW (spectrum e). Other EPR conditions are the same as in Fig. 4.
