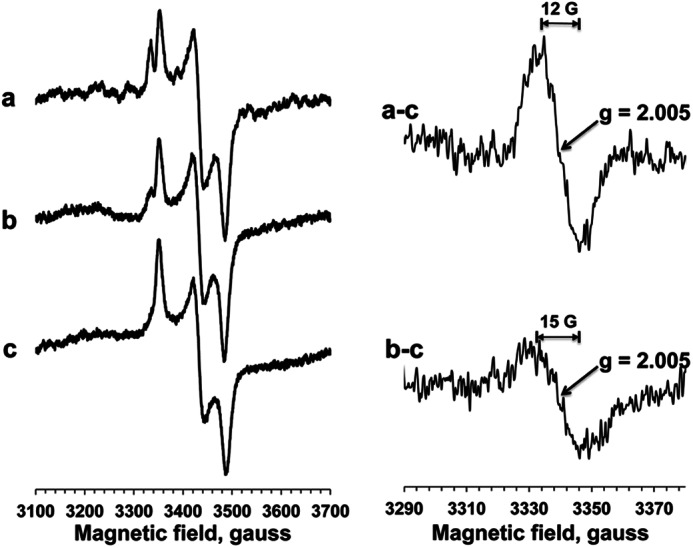
FIGURE 7.

EPR spectra of SQ signals in isolated complex I. Left, EPR spectra were recorded at 150 K and 1.2 mW. Complex I (15 μm) was reduced with NADH in the absence (spectrum a) or presence (spectrum b) of asimicin, a potent E. coli complex I inhibitor, or reduced with dithionite (spectrum c). Right, the difference spectra of NADH-reduced minus dithionite-reduced spectra in the absence (spectrum a-c) or presence (spectrum b-c) of asimicin.
